You have just migrated to Amazon Web Services, or deployed the latest and greatest next generation workload on AWS, but you are stuck on how best to choose that “ticker solution” to continuously monitor your website and supporting APIs to report against your business’ service level agreements (SLA).
Various options exist in the market today, ranging from a roll-your-own to SaaS – all offering similar capabilities and pricing models. A downside of some of these SaaS services is they are bundled packages. Do you need 10 or 50 endpoints to be monitored, why not just pay for 3?
A fair argument against some of these SaaS monitoring services is, that they are basic in nature, not offering the features to integrate into modern endpoints. One example is that only basic authentication protocols are supported with limited options to validate response payloads.
Introducing Amazon CloudWatch Synthetics – a pay-per-use service that supports monitoring of your REST APIs, URLs, and website content every minute, 24×7, and alerts you when your application endpoints don’t return the expected response.
The architecture of CloudWatch Synthetics is roughly defined as follows:
- An orchestration service offering a simple, yet effective configuration interface for those die-hard visual builders.
- Endpoints are monitored through a construct called a “canary”, implemented as an AWS Lambda Function
- The Lambda function “exposes a standard interface” so to speak, through which you inject some NodeJS code. These code-parts are responsible for performing the “endpoint configuration”, authentication and then validating the responses. These you have full control over.
- and of course – never forget about S3 to store some data
Best of all, CloudFormation extensions are in place – so managing these as part of the application and infrastructure codebase is easily done.
If you are interested in the deeper application stack that underpins the canary, have a look at the official synthetics documentation.
Setting up a canary
To setup a basic canary takes about 1 minute, and you are on your merry way, monitoring your website from about any AWS region. Although, it can be done through CloudFormation, the easiest way to get going is through the AWS Console. Let’s walk through the steps to setup your first canary.
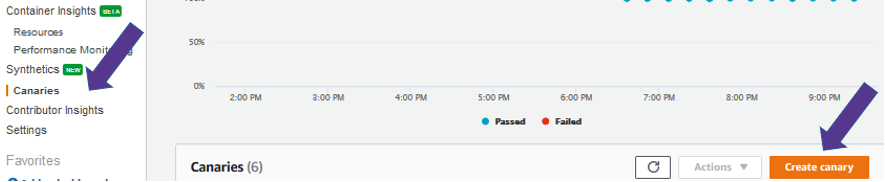
Navigate to Amazon CloudWatch in the AWS Console, in filter down to Synthetics.
Select “Create canary”
For those who are dying to try some CloudFormation – there is a sample ready to go, which include the bucket and role – have a look here (but remember to come back and have a look at the cost)
The AWS Console offers a very easy to navigate and configuration experience – with the added advantage of “blueprints” to get you started. These blueprints cover the most frequently used scenarios, including a basic URL-check, support for API-integrations, and even a broken link checker. A more advanced blueprint allows you to configure a browsing experience through a website, simulating true site-visitor behaviour.
Stepping outside of blueprints, with NodeJS and the AWS SDK at your disposal, you can pretty much accomplish any complex monitoring task.
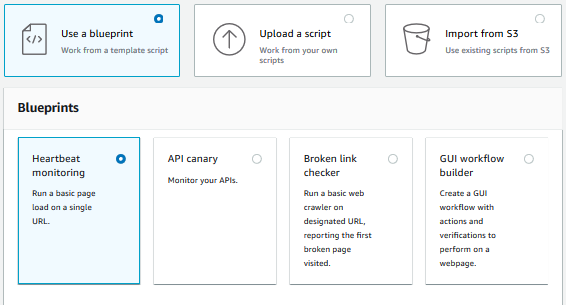
For a basic demonstration, we will use “Heartbeat monitoring” – in short, it performs a website load of a given URL, validates the response success, captures the HTTP page-data in an HTTP Archive (HAR) and takes a screenshot. Also, all this data is nicely tucked away in S3 for your convenience.
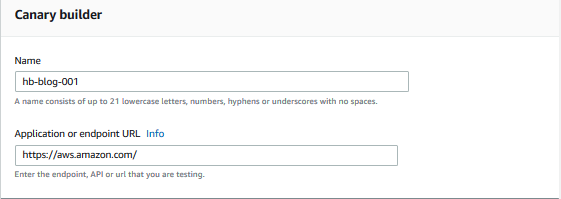
A small number of configurations are required to get going:
- a name of course
- the URL to be monitoring (e.g. https://aws.amazon.com/)
- the schedule – once, or every 1 – 60 minutes
- the data retention period
- an S3 bucket is selected for you (keep it default for this exercise)
- and lastly, the all-important IAM-role
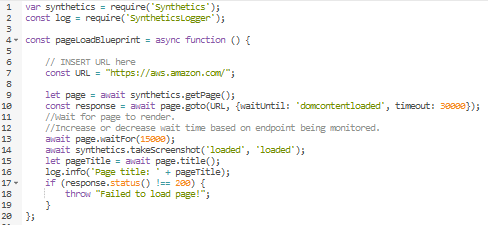
The console experience completes the “code” on your behalf and is based on the configurations you provide – this easy experience allows anyone to setup a canary to monitor a website or API.
With the URL “aws.amazon.com” provided, the code is automatically completed, with the ability to further customise the code should you have the need to do so. This may be very pertinent when you are performing API-endpoint canaries and want to validate the API-response data.
No additional configuration is needed for a basic setup. Creating the canary takes about 30seconds and you are in the first-row seats watching your canary do the monitoring.
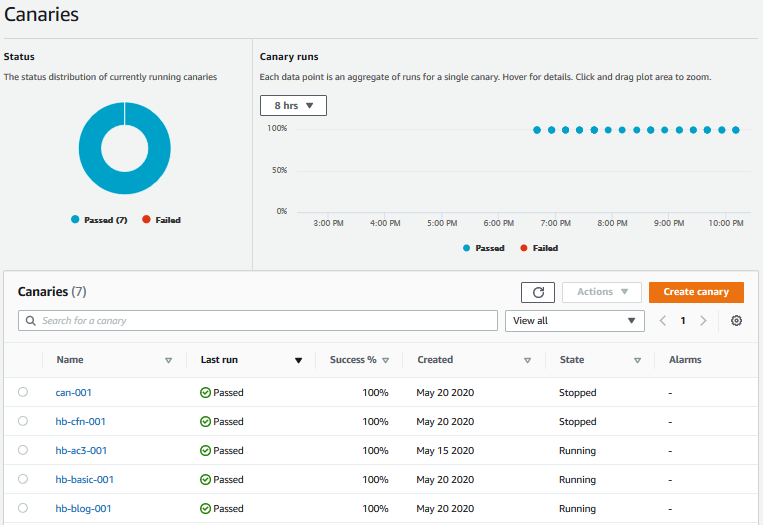
Once you have a canary or two, you will be presented with a simple, yet informative dashboard. These metrics are also available in CloudWatch, so more complex and integrated dashboards could be defined where needed.
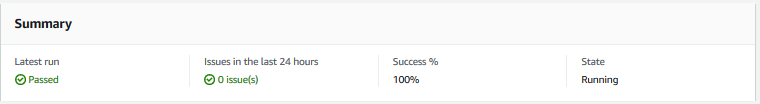
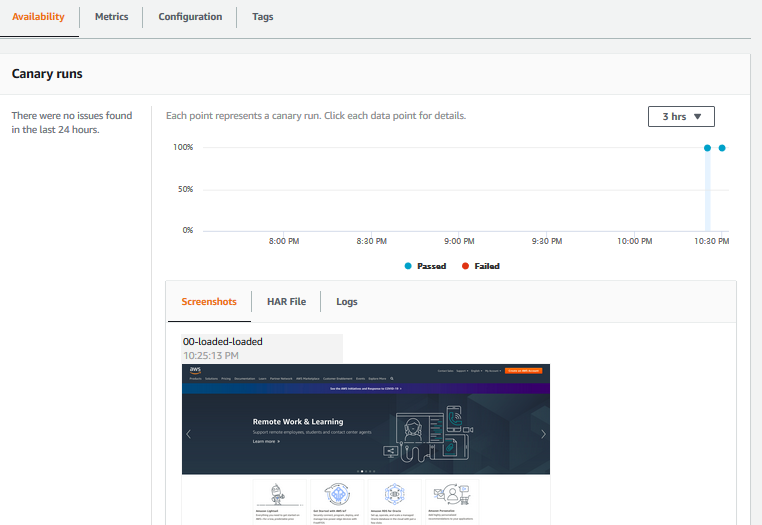
Navigating into the canary reveals the next level of depth, offering a summary, a screenshot, the HTTP details, and an execution log.
The HAR file (HTTP Archive) offers an in-depth analysis of the page-load activity and the assets loaded. A good source of information should there be components or sections that did not render as expected.
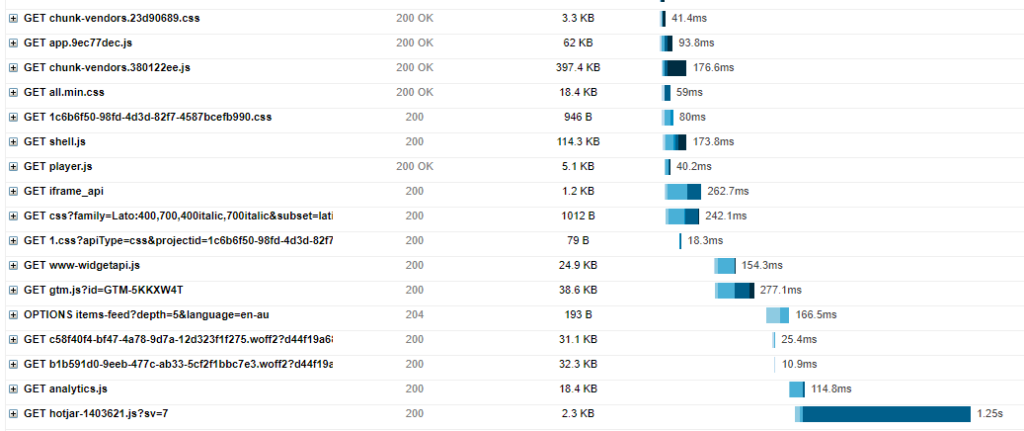
All this data and screenshots are also easily accessed through the underlying S3-bucket, so integrating the outputs into other monitoring and operations tools or dashboards are possible.
VPC based endpoints monitoring
A feature that place CloudWatch Synthetics in the pole position is the ability to integrate into a VPC – allowing monitoring of internal, private or non-public websites, application-endpoints and other critical backend-service APIs. This is simply underpinned by a VPC-based Lambda but offers a very efficient mechanism to monitor internal workloads without the need to configure networking for monitoring tools.
Notifications
Where a canary fails to obtain the expected result from the website address or endpoint, notifications are orchestrated through CloudWatch Alarms and SNS as normal. The Synthetics console wizard-experience sets up the alarm, but you are still responsible for the SNS-topic configuration to get the notification to your email-inbox or incident response tooling.
That is Amazon CloudWatch Synthetics in a nutshell.
Cost
At a cheap entry of US$0.0017 (AP-southeast-2) per run, it sounds too good to be true, and for an occasional check it is – no coding, no infrastructure, no licensing, no developer time. I setup a few canaries as part of writing this blog and the very next morning I got a notification that my $100 budget is forecasted to be exceeded by a lot. Scratching my head, I could not put my finger on it, until I opened the Cost Explorer. Some figures to take home are noted below.

These costs do not include the S3 storage, underlying CloudWatch or Lambda execution costs.
Modern websites and web-applications may have a dozen or more endpoints that make up the overall successful customer experience. A conservative 10 endpoints monitored at a 1-minute interval (because we want to prove that 99.95% SLA) does start to add-up to a line item worth noting on your AWS invoice.
Critical Systems Monitoring
Where very strict SLA’s and other Service Level Indicators (SLI) around endpoint availability is at play – monitoring from just one region is not considered best practice. Amazon CloudWatch offers a 99.9% Service Commitment SLA – so keep that in mind when you have 99.99% SLAs with customers.
Where reporting on endpoints are needed that tie into commercial agreements, this may not be good enough. In scenarios like these, setting up canaries in two or more regions may be required to ensure the SLA-reporting can be met in the unlikely event of a Lambda or CloudWatch service impairment in a specific region that impact in your reporting.
Conclusion
Amazon CloudWatch Synthetics offers a quick-start mechanism to get going with website and API monitoring, especially on internal workloads locked away in a VPC. It offers a good set of capabilities at a competitive entry price point. A monitoring contender for organisations without dedicated engineering teams or even organisations that need to monitor a handful of endpoints, but that is where I would start to weigh up my options, especially if you have hundreds of endpoints to monitor.
Scaling it back a bit to good middle-ground, and considering the benefit vs. price point, 10 canaries at a 2-minute interval will still set you back approx. AU$570 per month – a solid business investment I would say.
Looking on the other side of the scale, say your organisation needs to monitor hundreds of endpoints and assume you happen to have a dedicated engineering team or Cloud Centre of Excellence (CCoE) at your disposal. You could perhaps afford an engineer to dive into some code for a few days, setup a small Lambda based framework with some CloudFormation – delivering a similar solution and blinking CloudWatch Dashboard for a less than $20.00 per month, but you must factor in the Total Cost of Ownership (TCO) here.
Comparing Amazon CloudWatch Synthetics to other SaaS solutions, it does stand out as a quality service at a good price point for the features offered – AWS native integration and VPC support cannot be beat.
A very well-defined service in my opinion and worth a look at when selecting your next endpoint monitoring solution.